Summary
I led a cross-functional onboarding initiative to surface real-world gaps, define success metrics, and design patterns that shorten time-to-access and improve early-tenure confidence. The outcome: a unified journey framework, provisioning flows, and a prioritized roadmap grounded in evidence.
Note: Excerpts are intentionally reduced to protect IP.
Context & Challenge
New hires were losing days to fragmented processes across HR, IT, and business operations—waiting on access, equipment, and approvals. Ownership was unclear, handoffs slipped, and satisfaction dipped in the first weeks. We needed a coherent experience with explicit roles, sequencing, and measures of success.
Approach
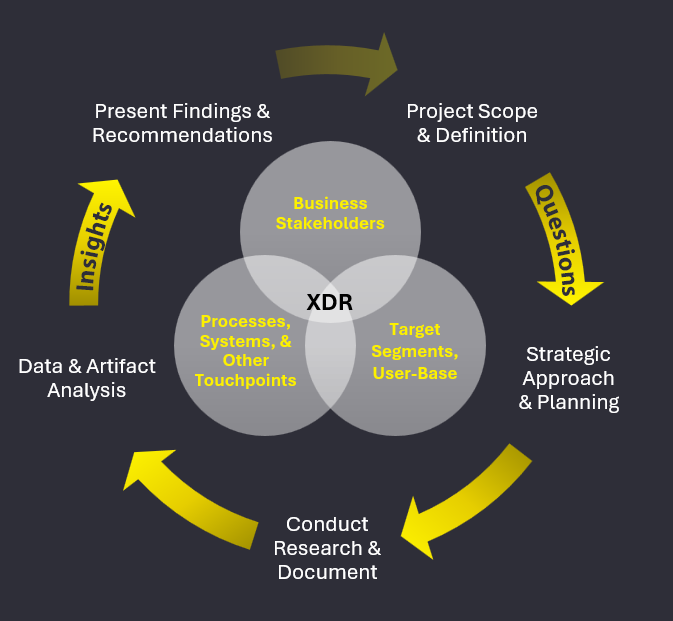
Discover & Align
I ran design-thinking workshops in Miro to capture business and technical requirements, user needs, and priority use cases; then closed gaps through contextual inquiry with regional SMEs to understand local workflows and policy constraints.
Design & Prototype
Using verified requirements, I produced service blueprints and UX flows—plus a Figma-based component system for provisioning, access requests, and Day-1 setup—so we could test quickly and iterate with stakeholders.
Build & Govern
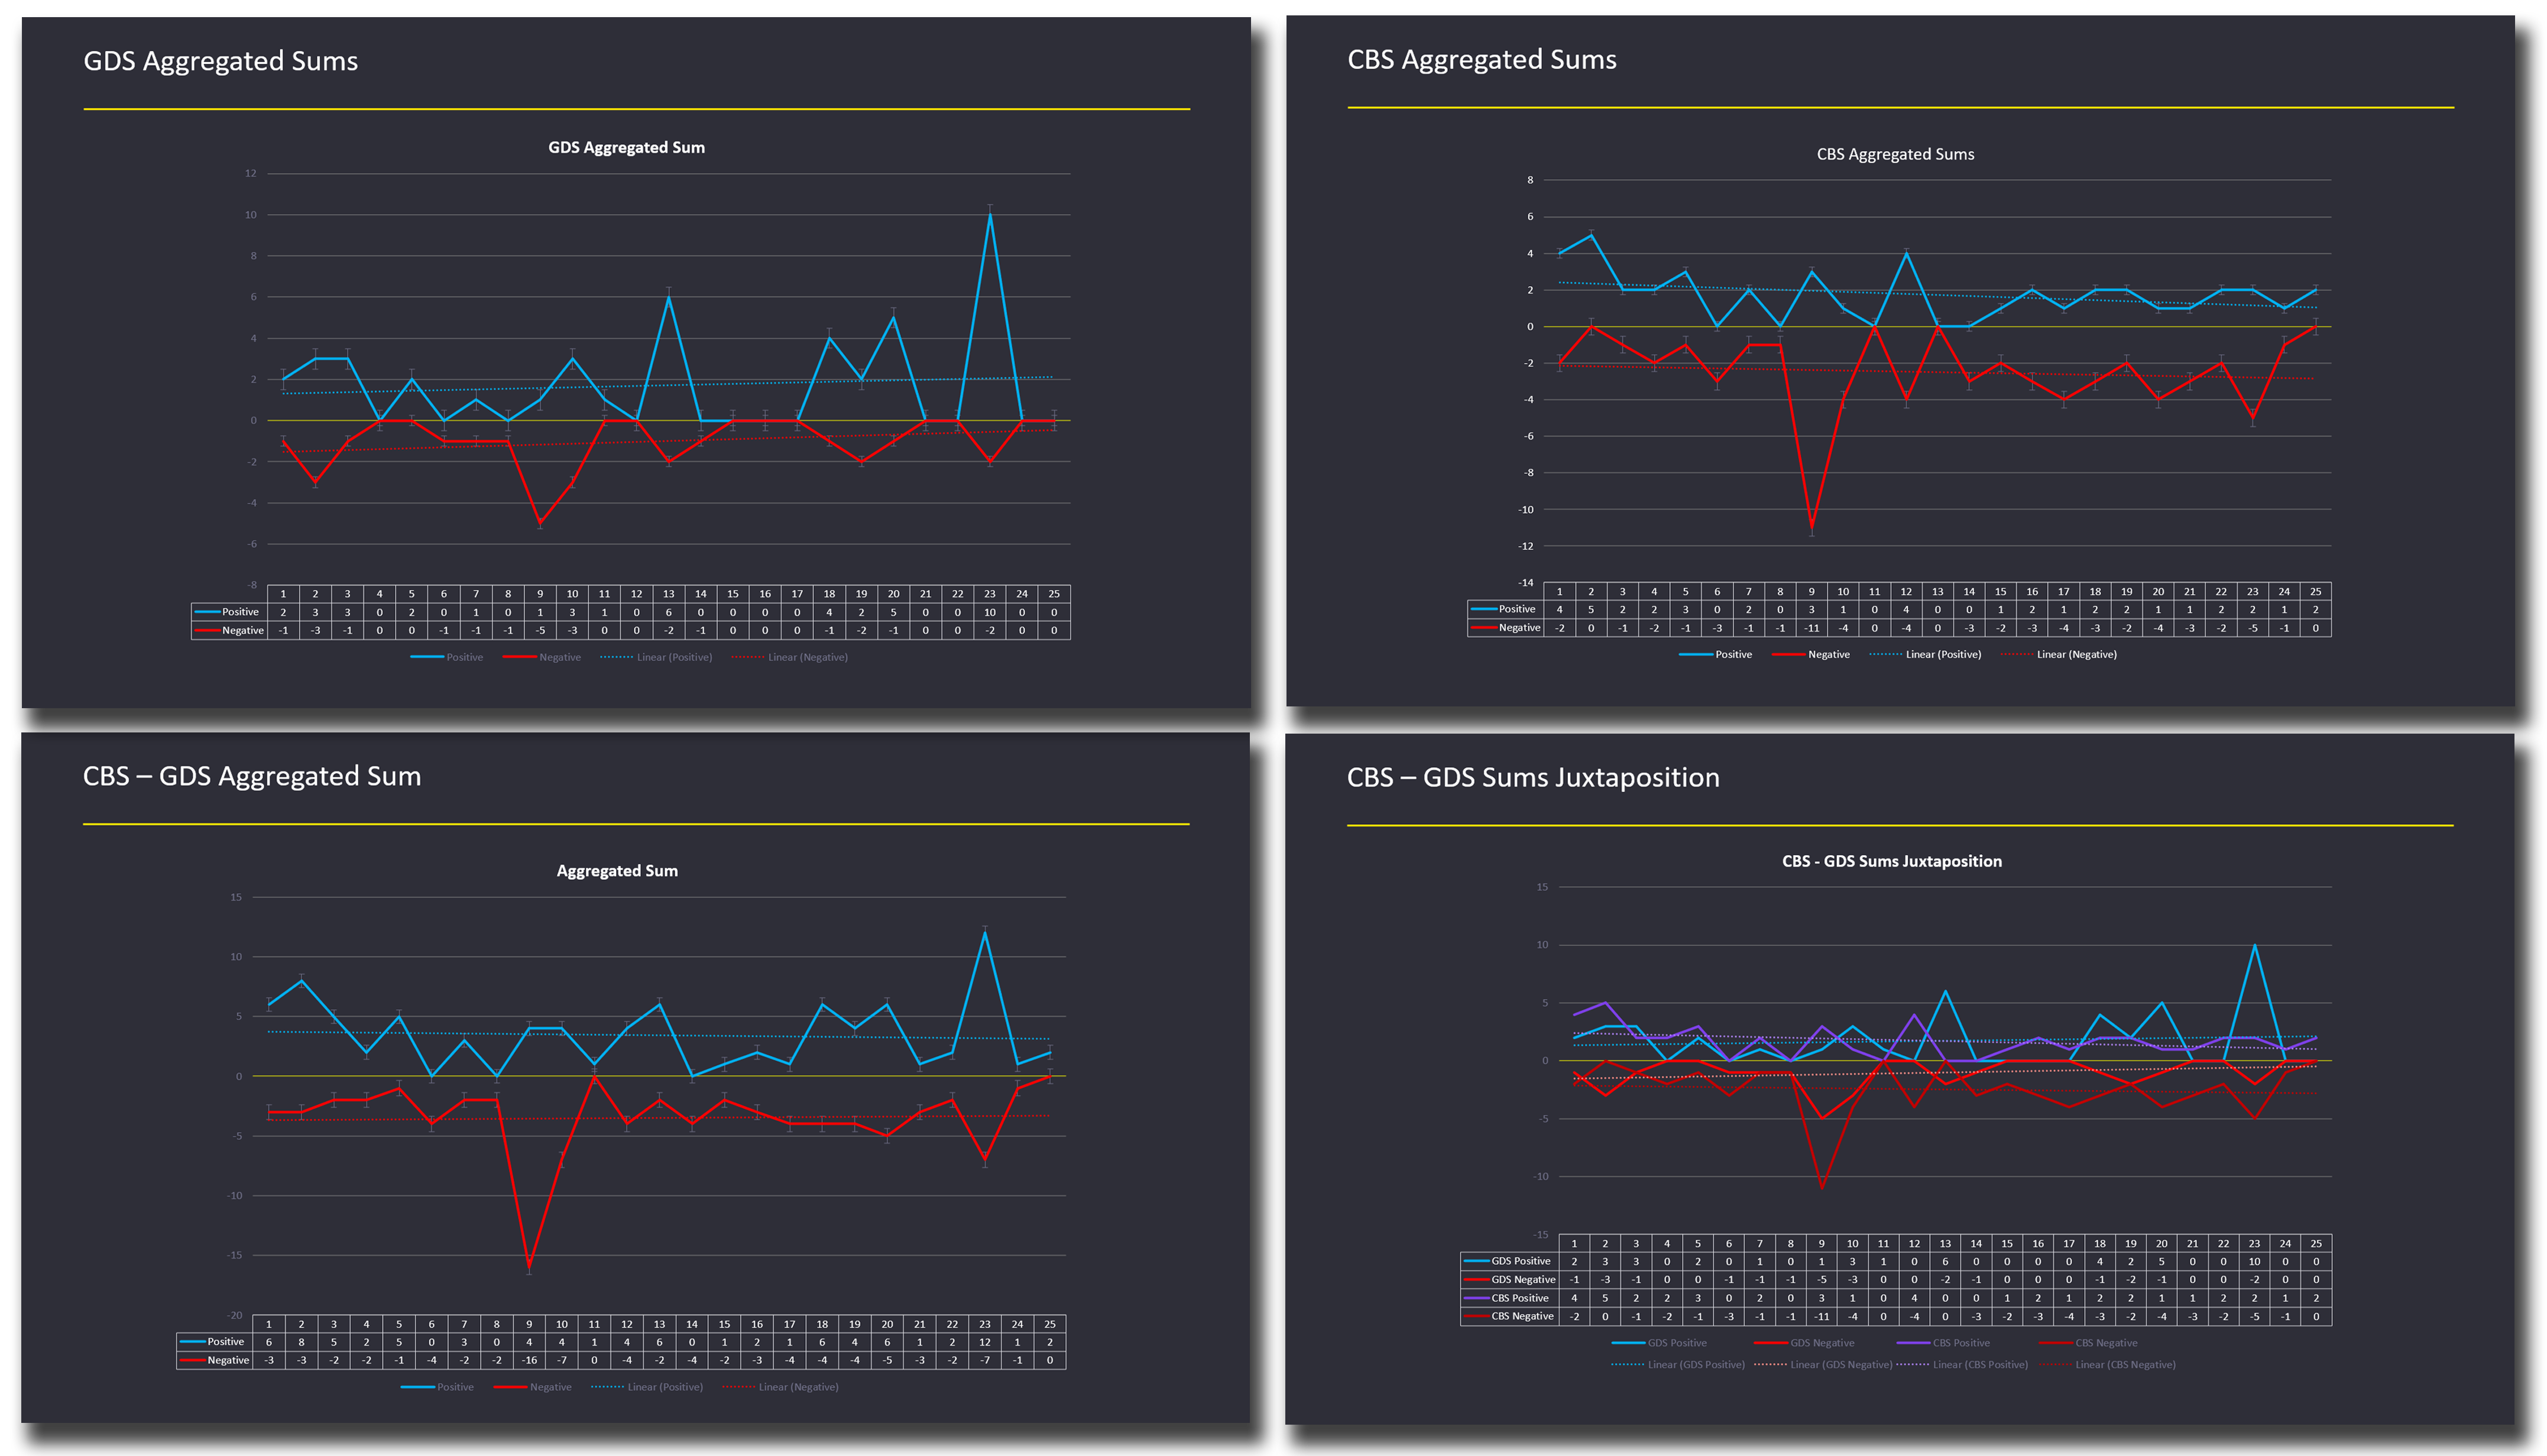
I formalized version-controlled requirements (functional/non-functional, accessibility) as the single source of truth; seeded UAT scenarios; and defined KPIs (time-to-access, completion rates, first-week satisfaction) for post-launch tracking.
Test & Iterate
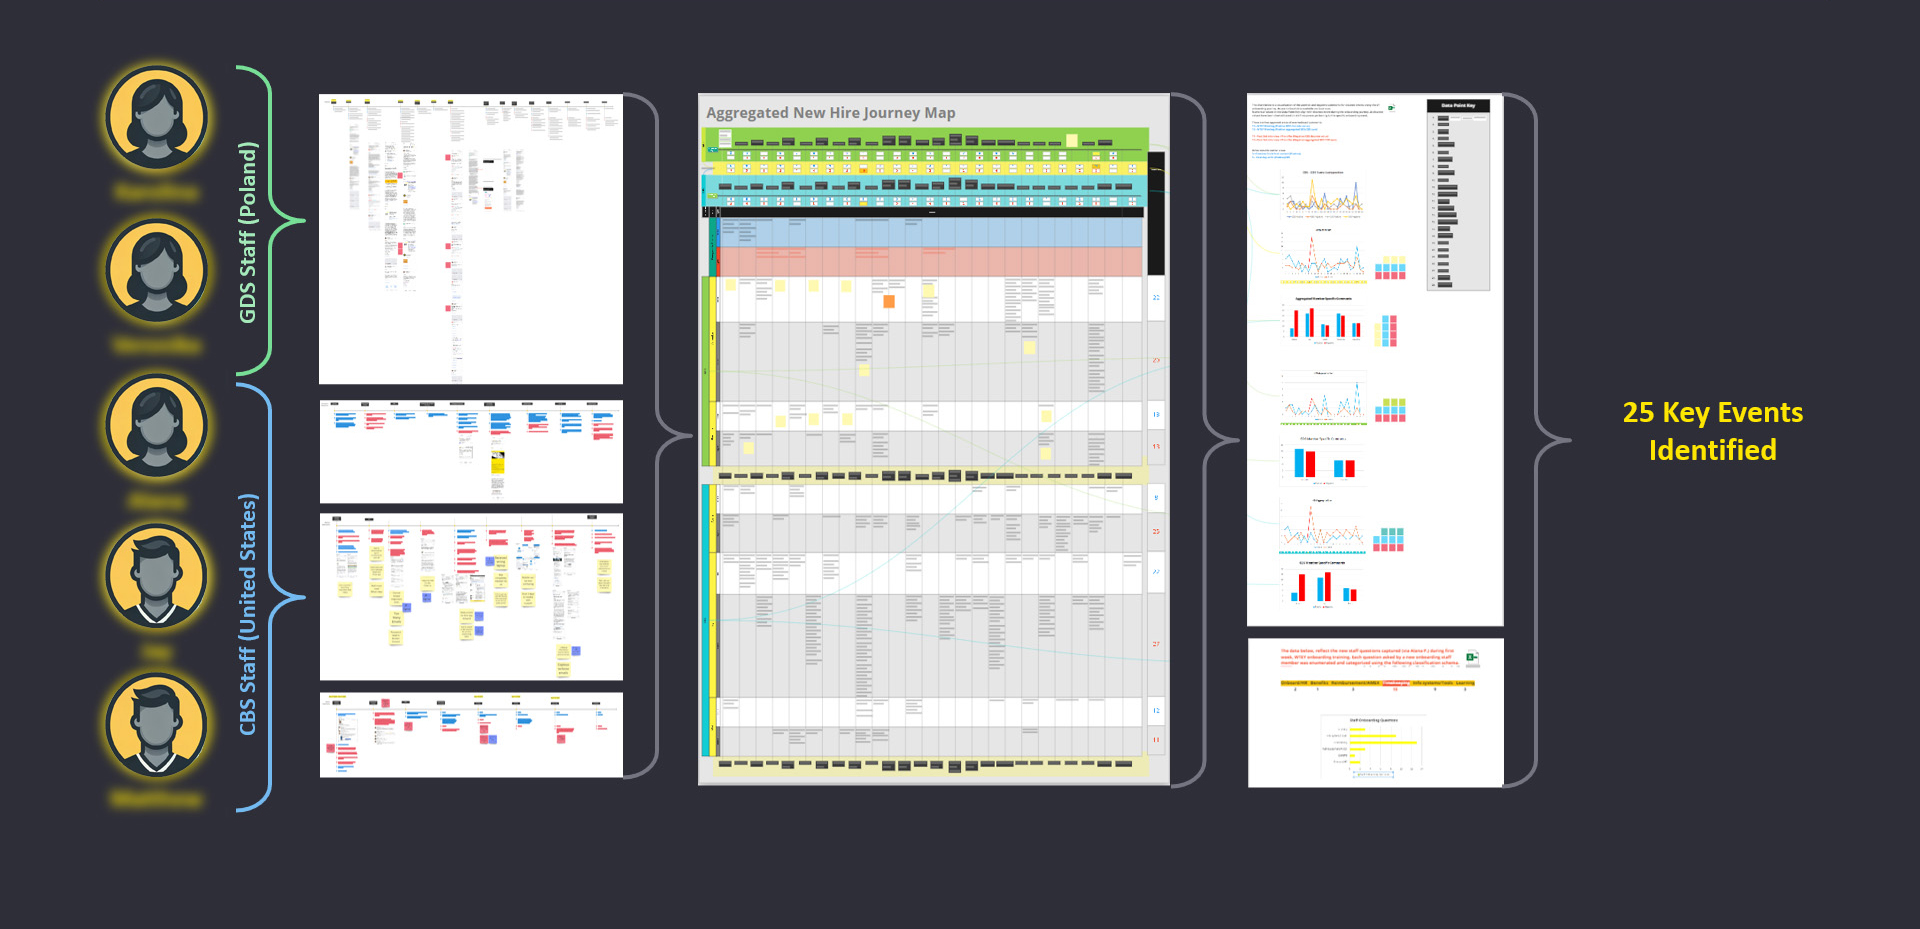
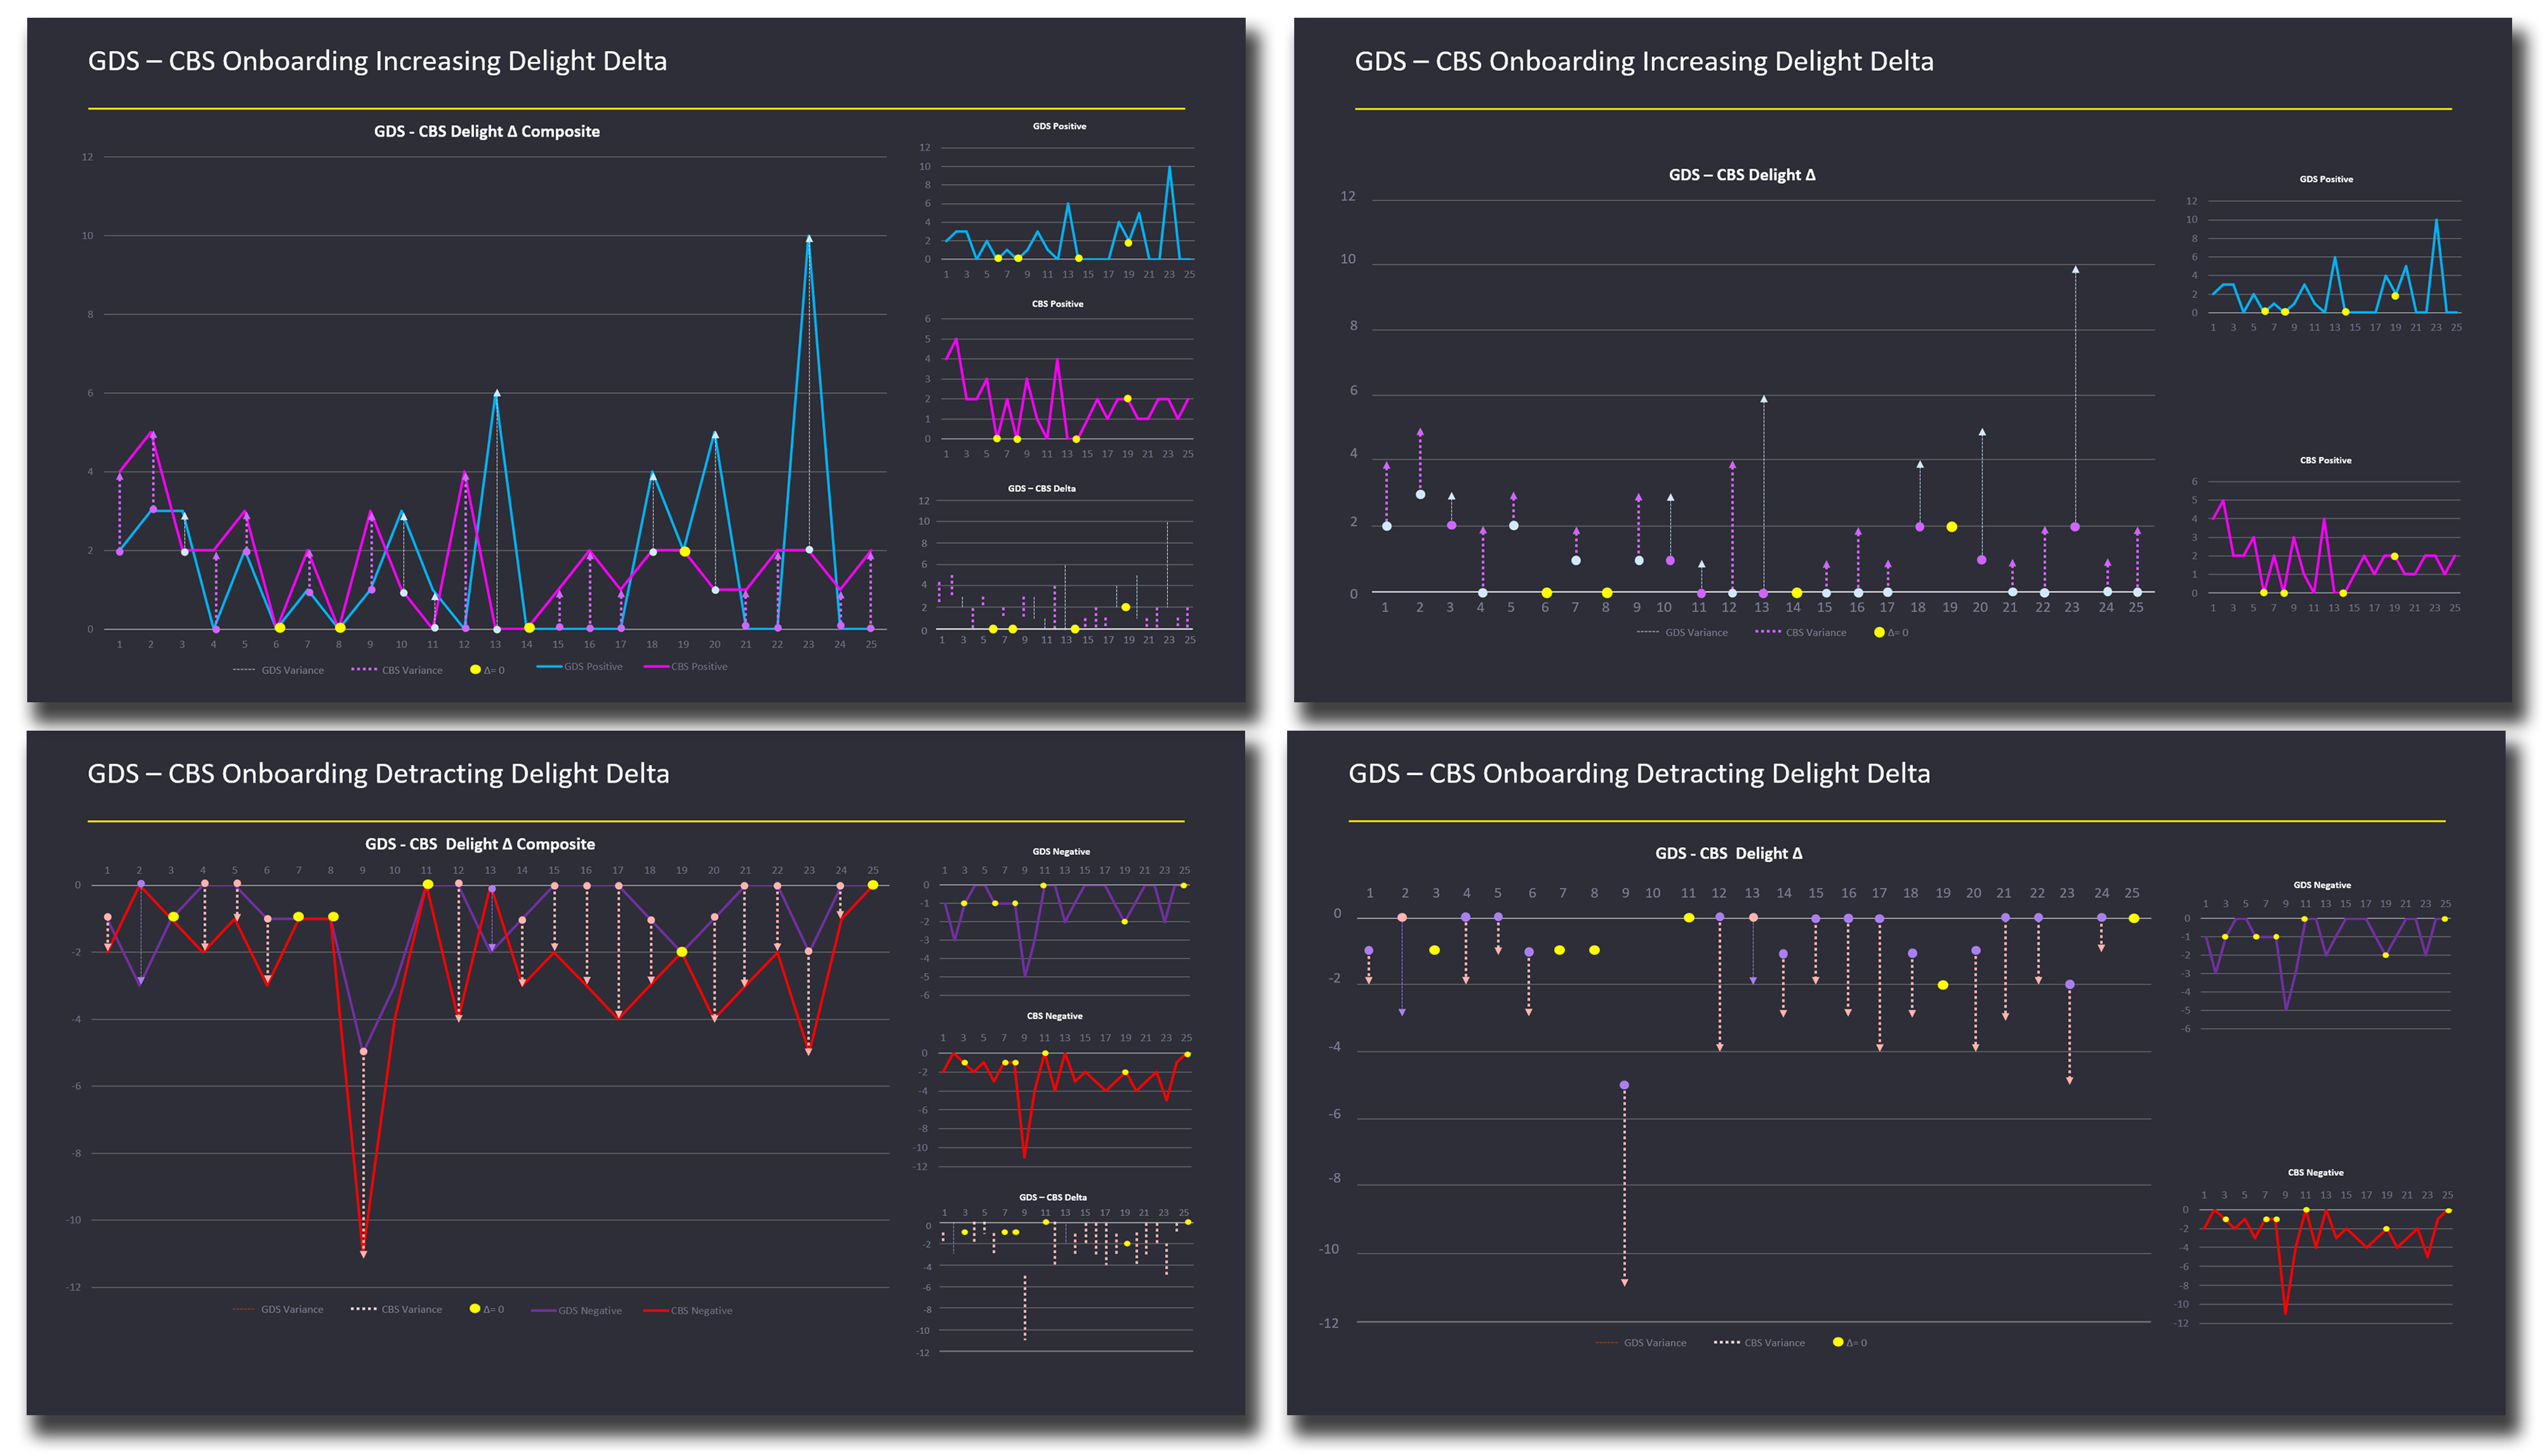
We validated with representative roles and regions; findings refined content, sequencing, and escalation paths. Insights informed the implementation roadmap and localization guidance.
Outcomes
- Unified journey & RACI aligning HR, IT, and business handoffs.
- Provisioning patterns & flows ready for pilot and scale.
- Measurement plan for time-to-access, role clarity, and early-tenure satisfaction.
- Prioritized roadmap sequencing quick wins and foundational investments.
Deliverables
Research & Strategy
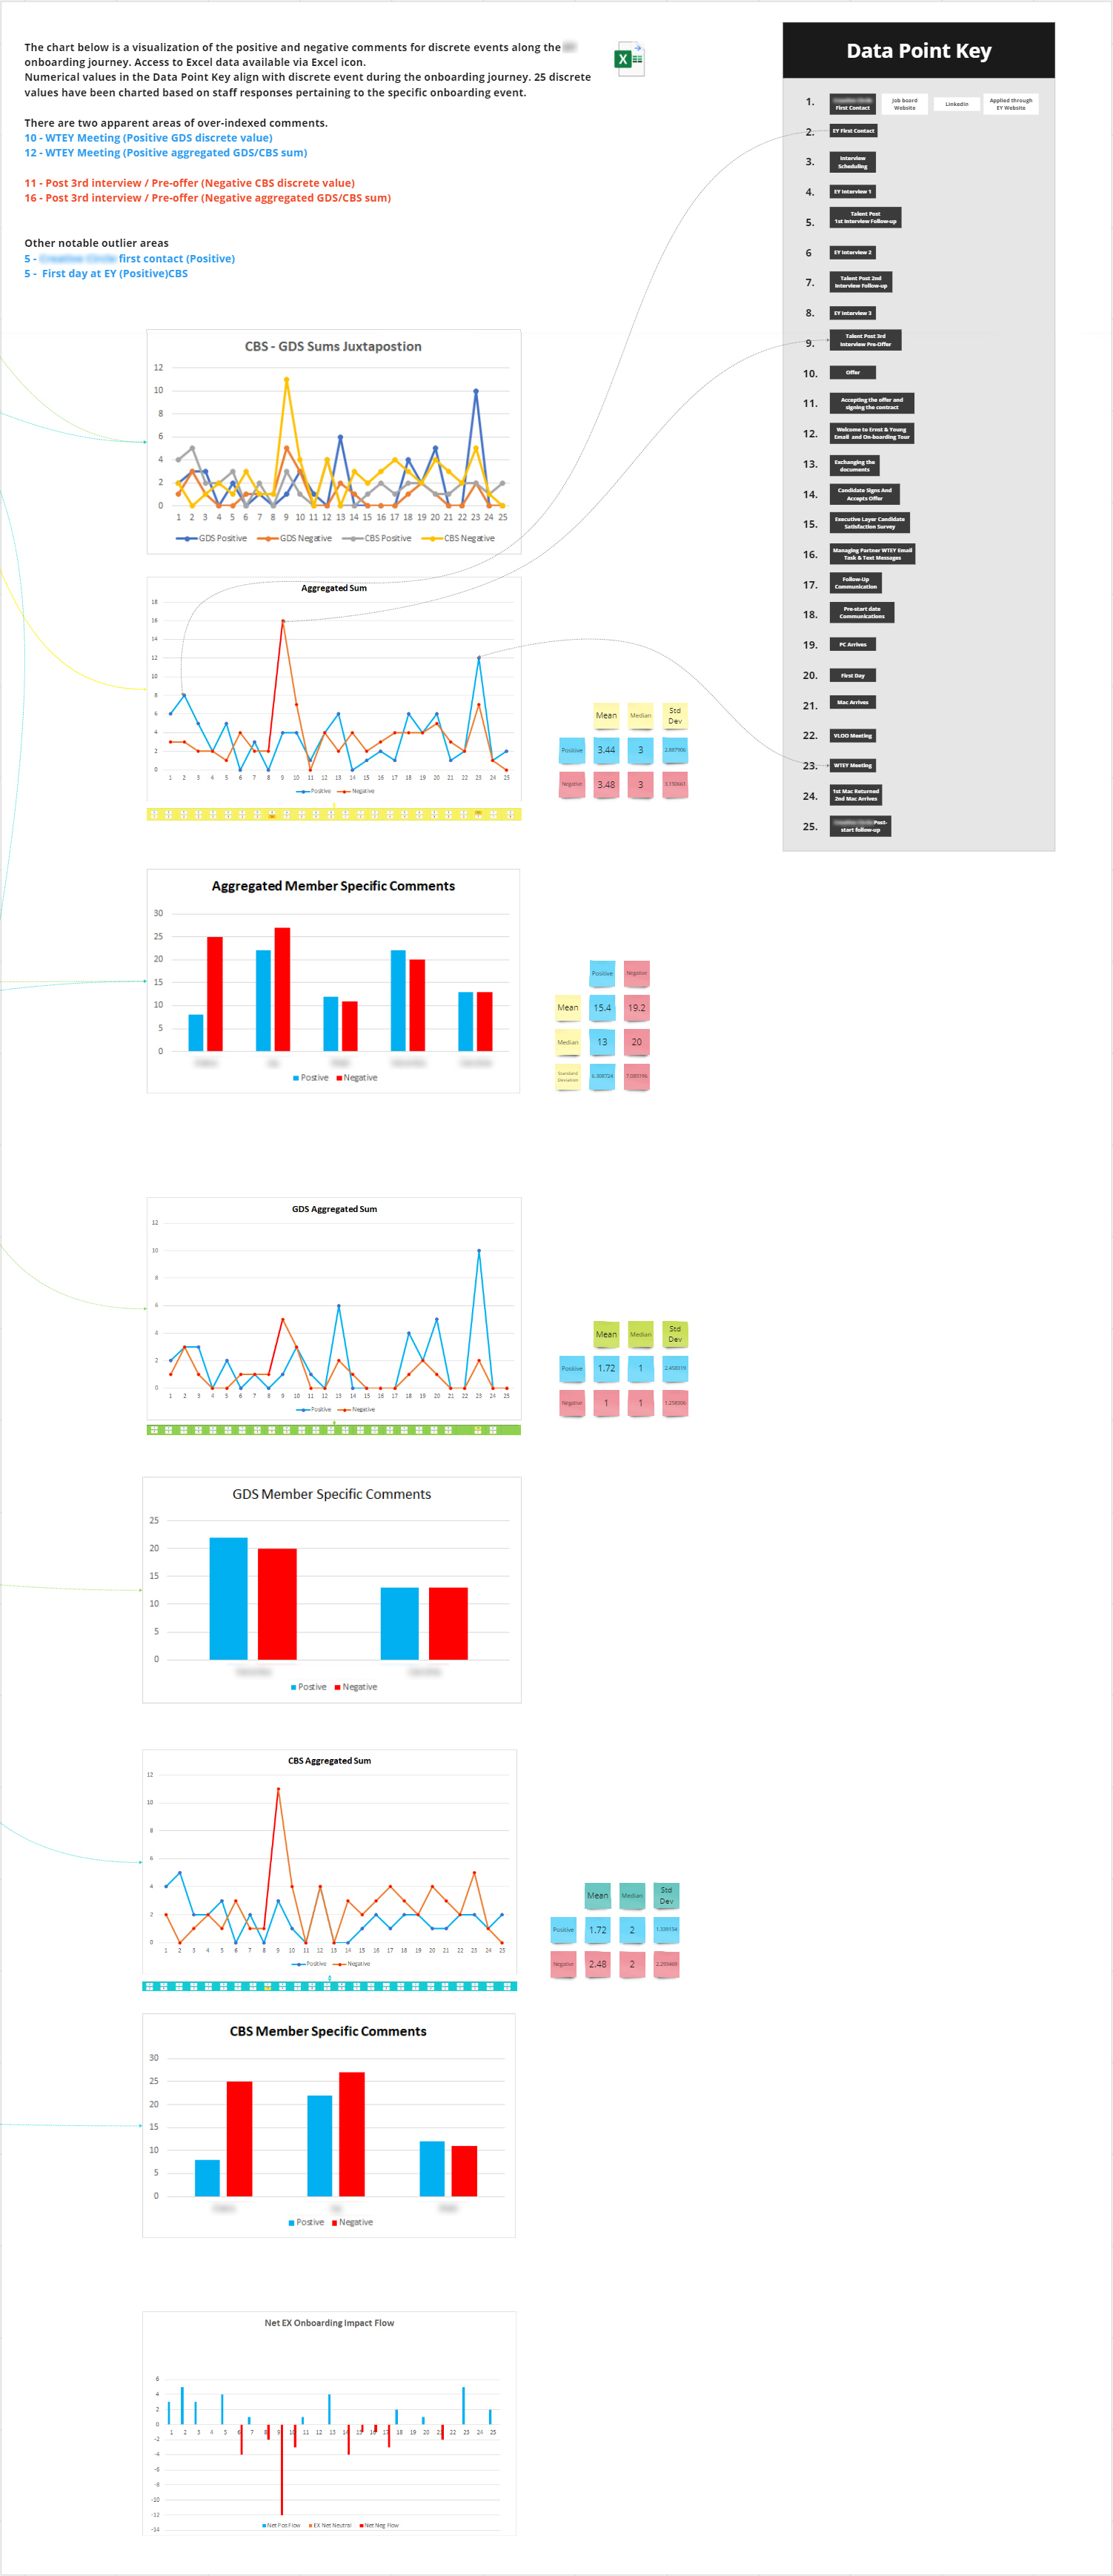
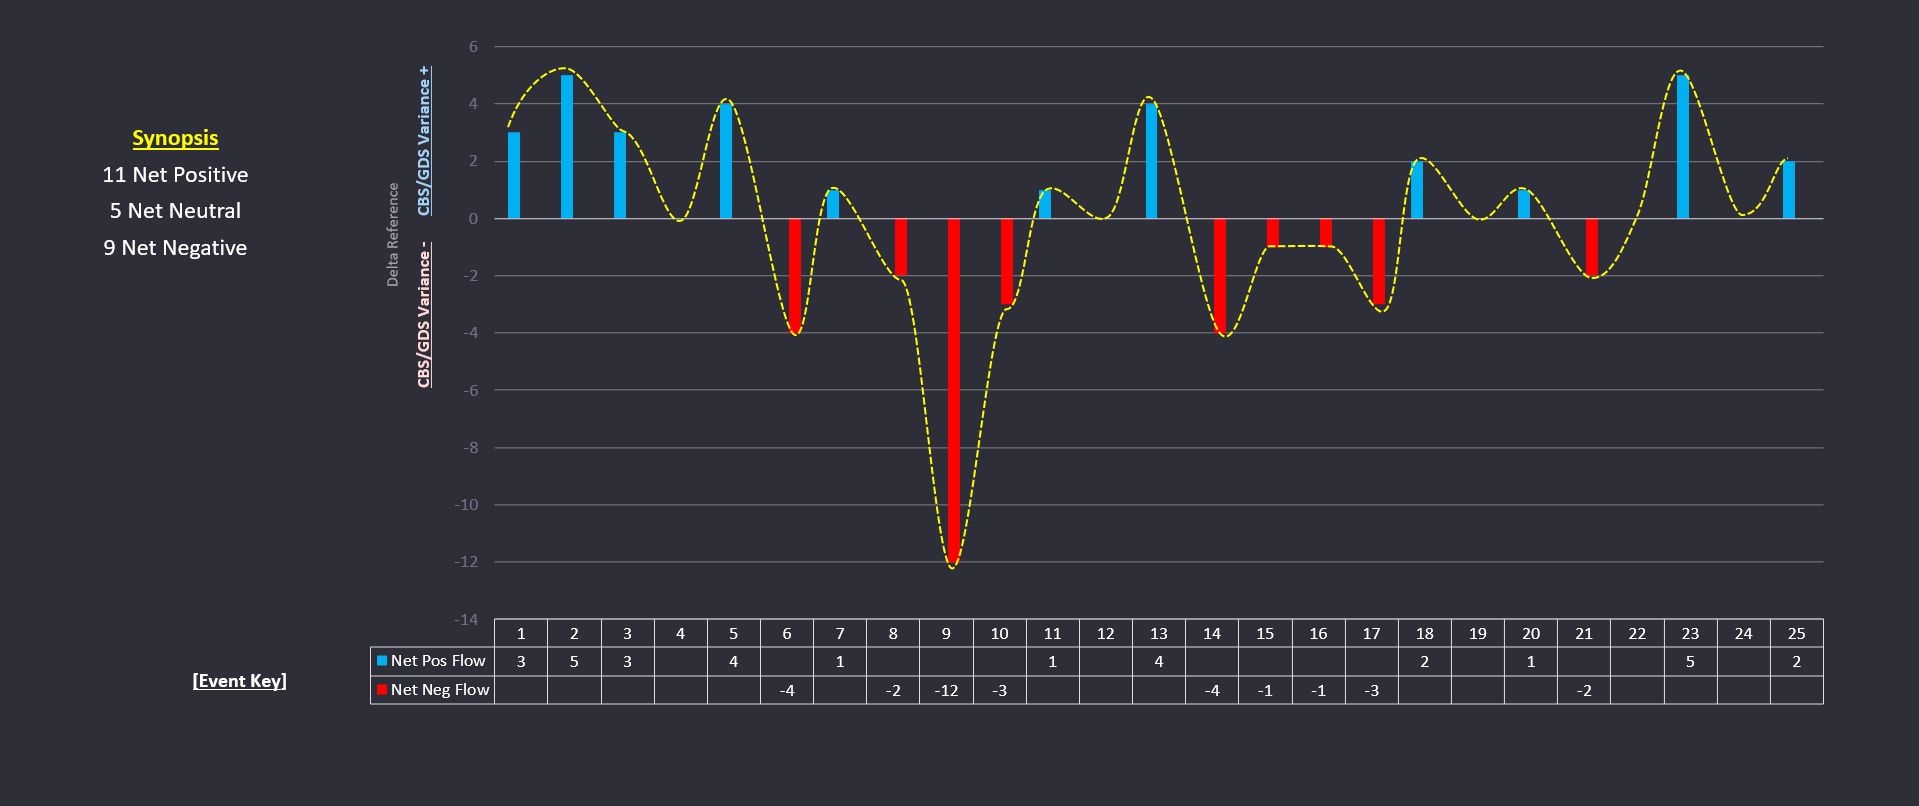
- Discovery synthesis & baseline metrics
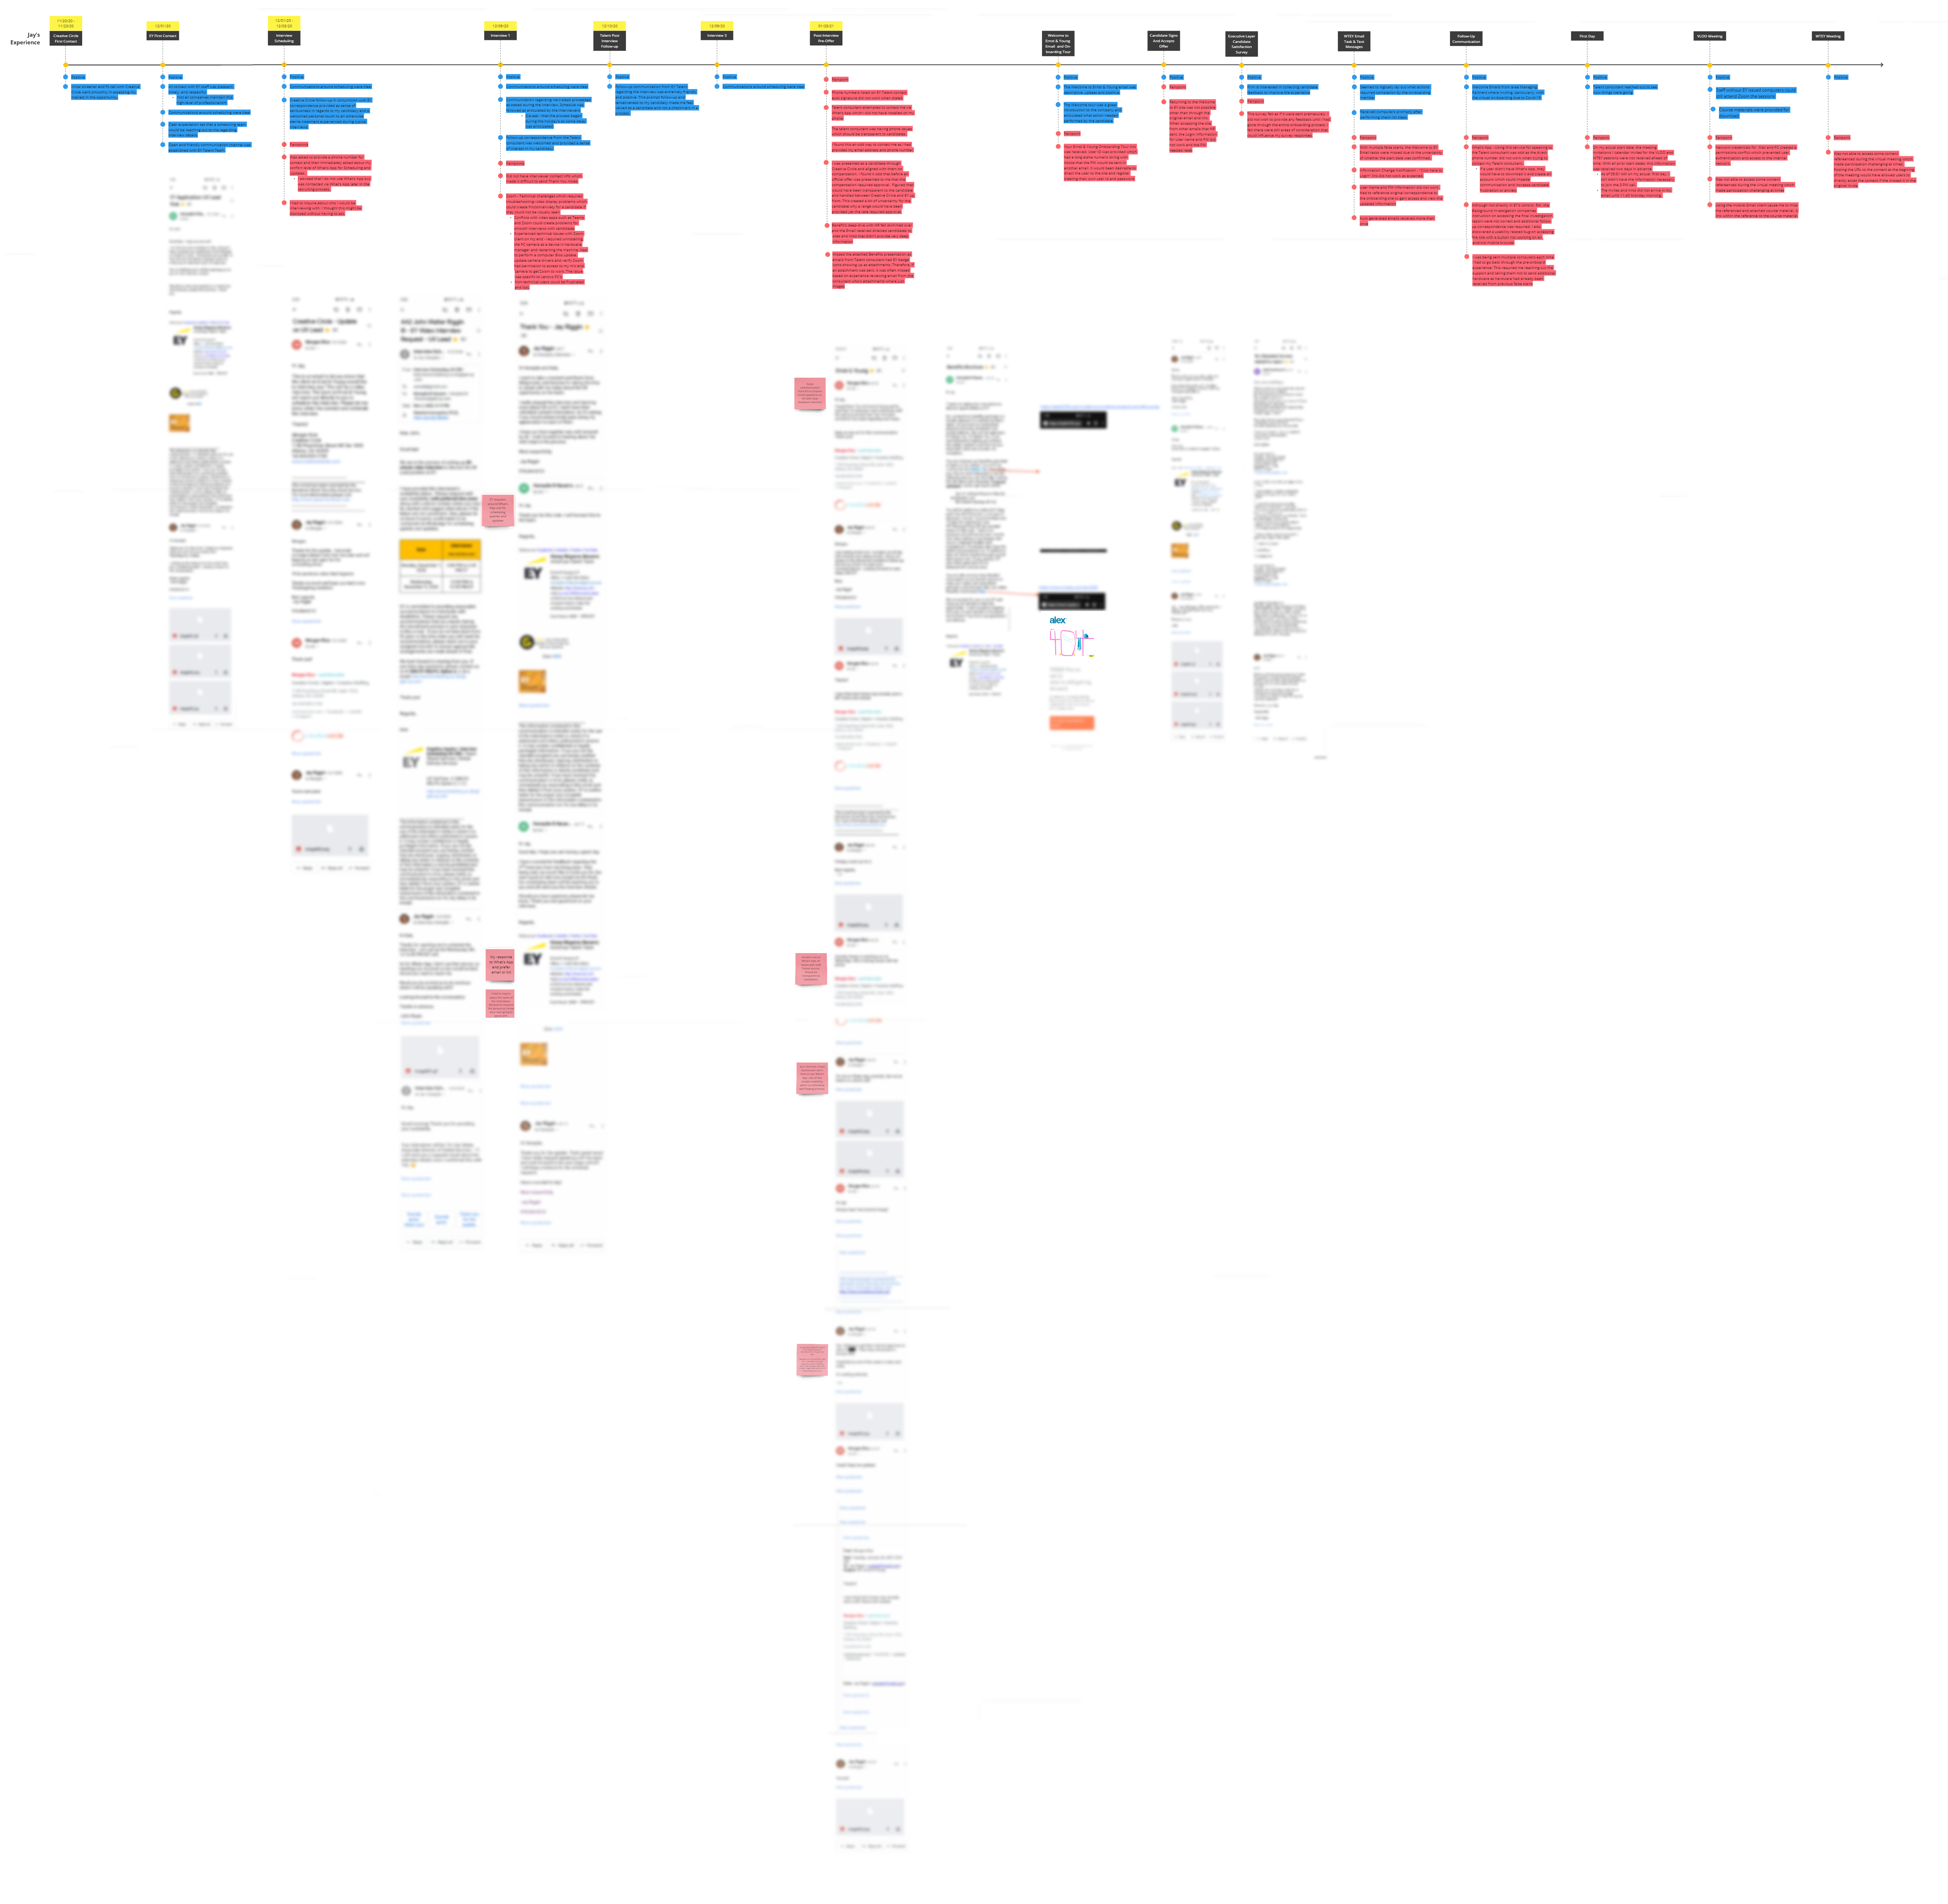
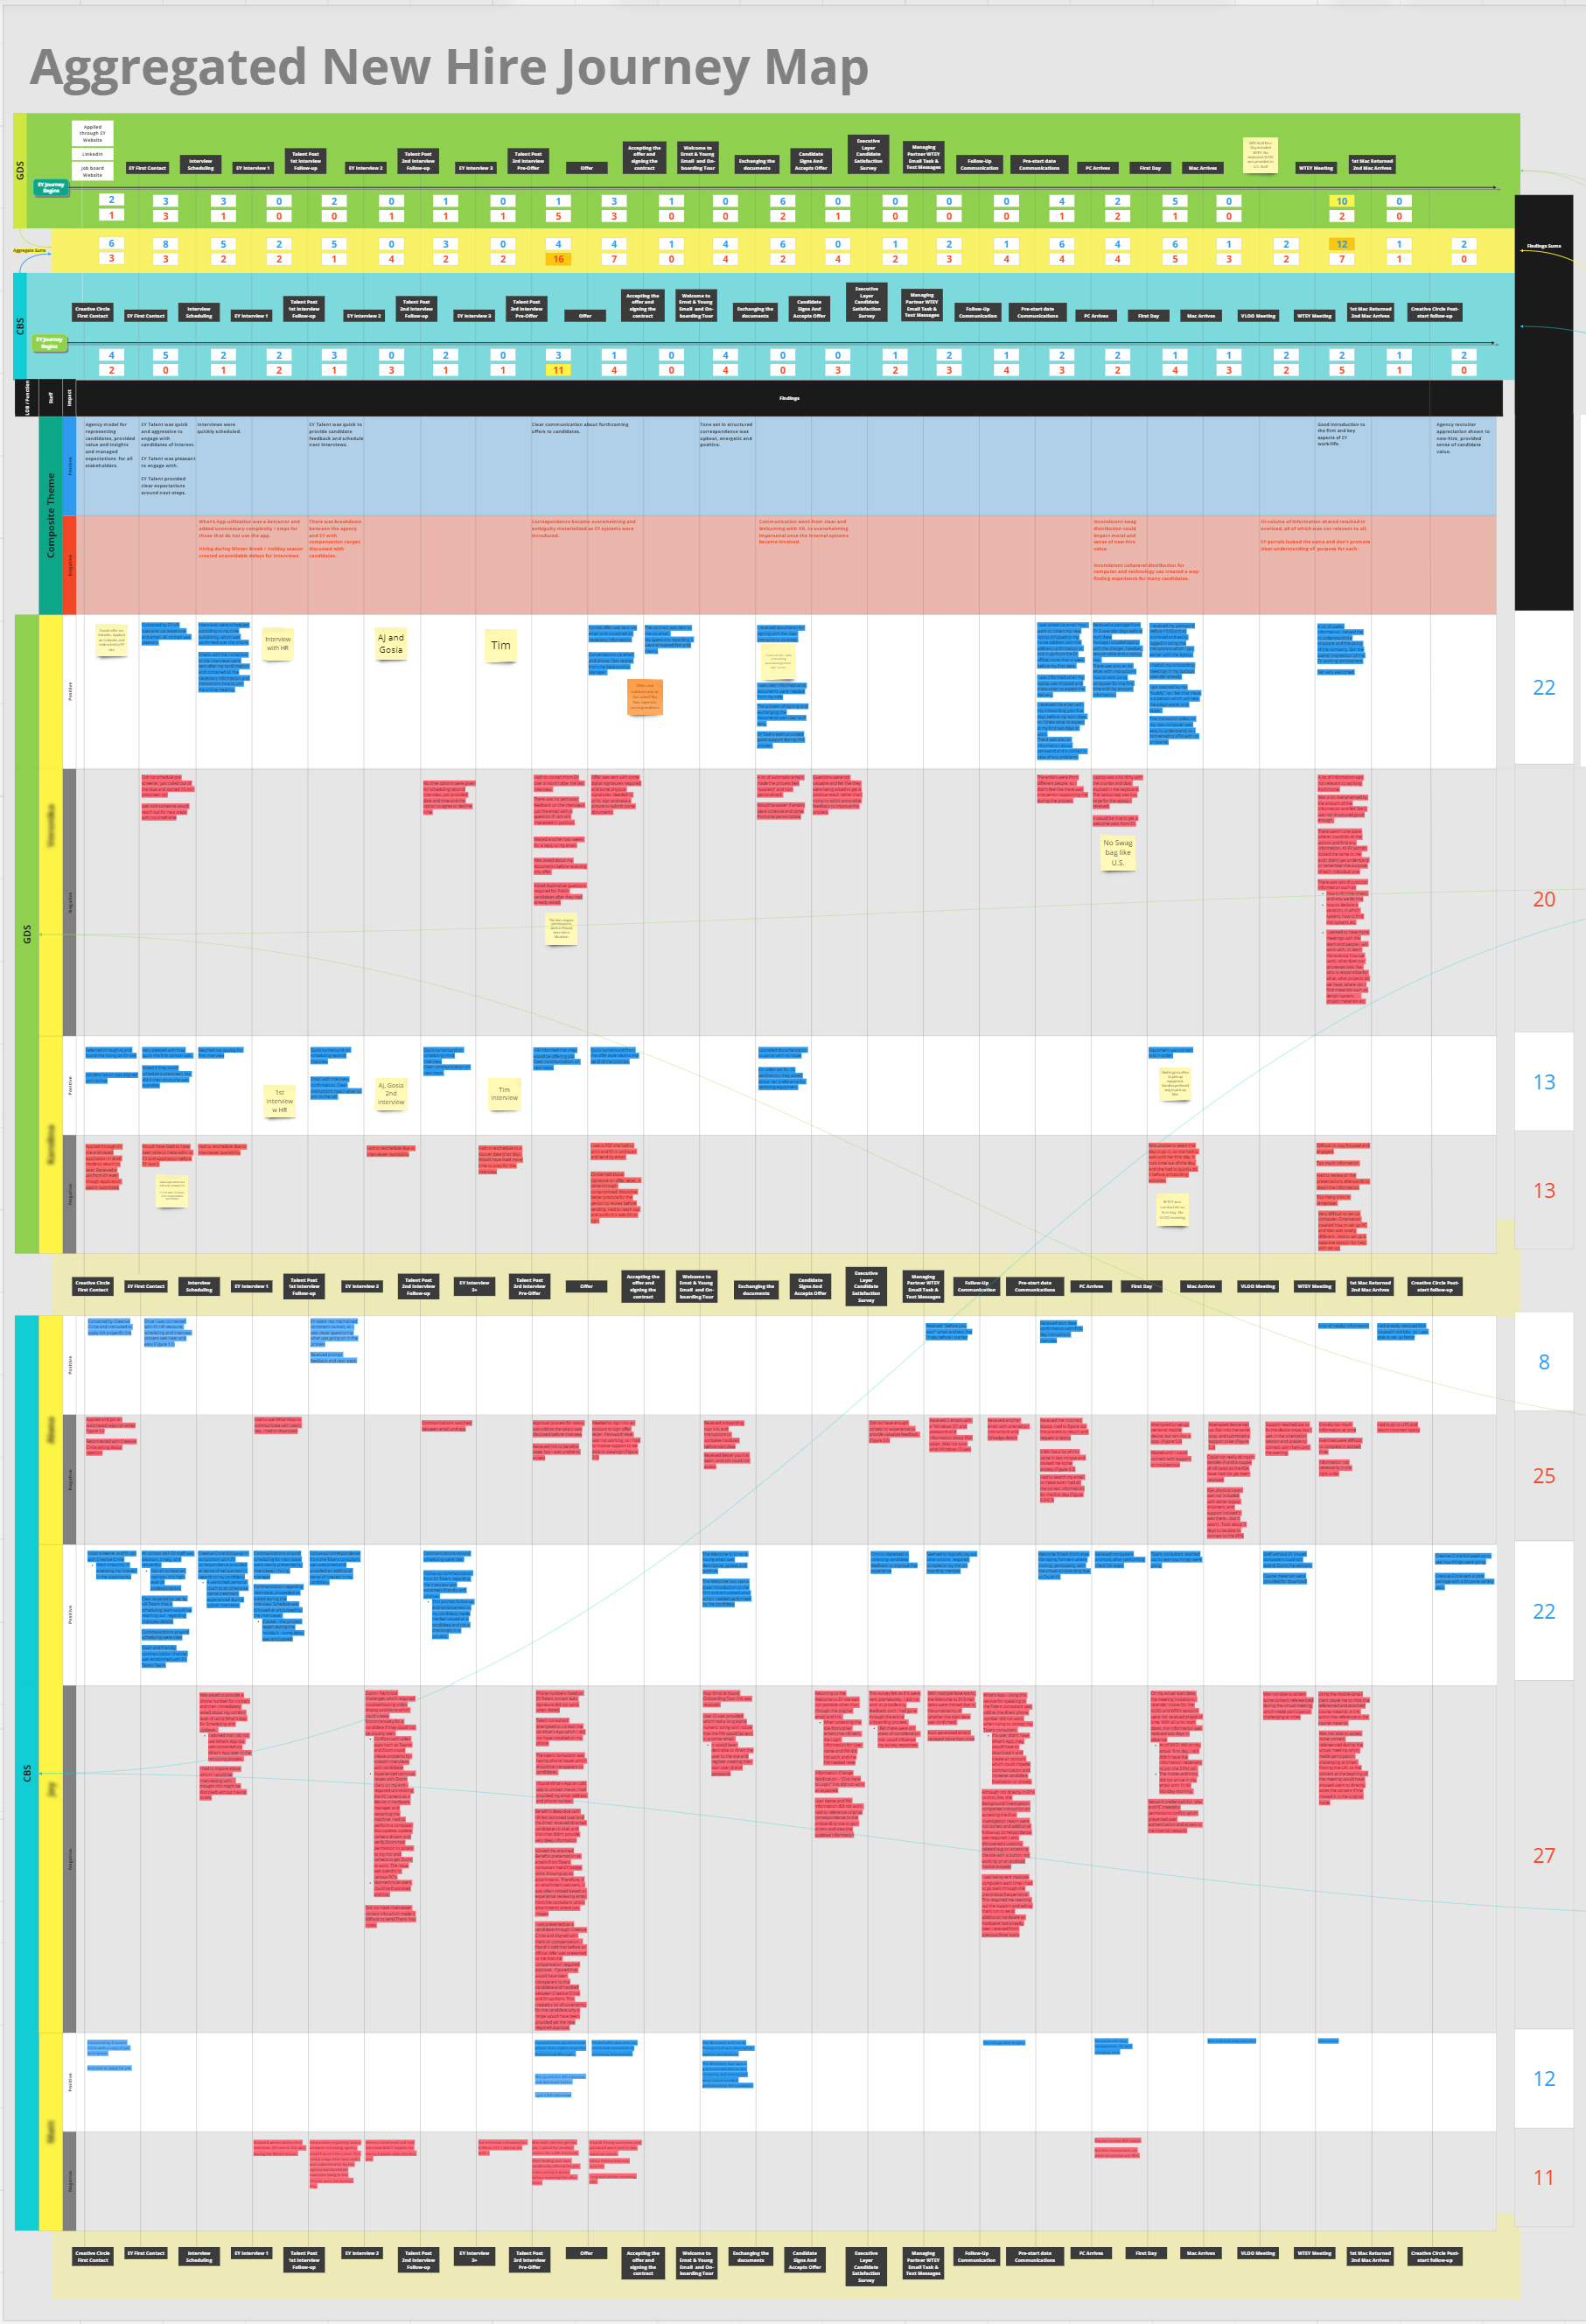
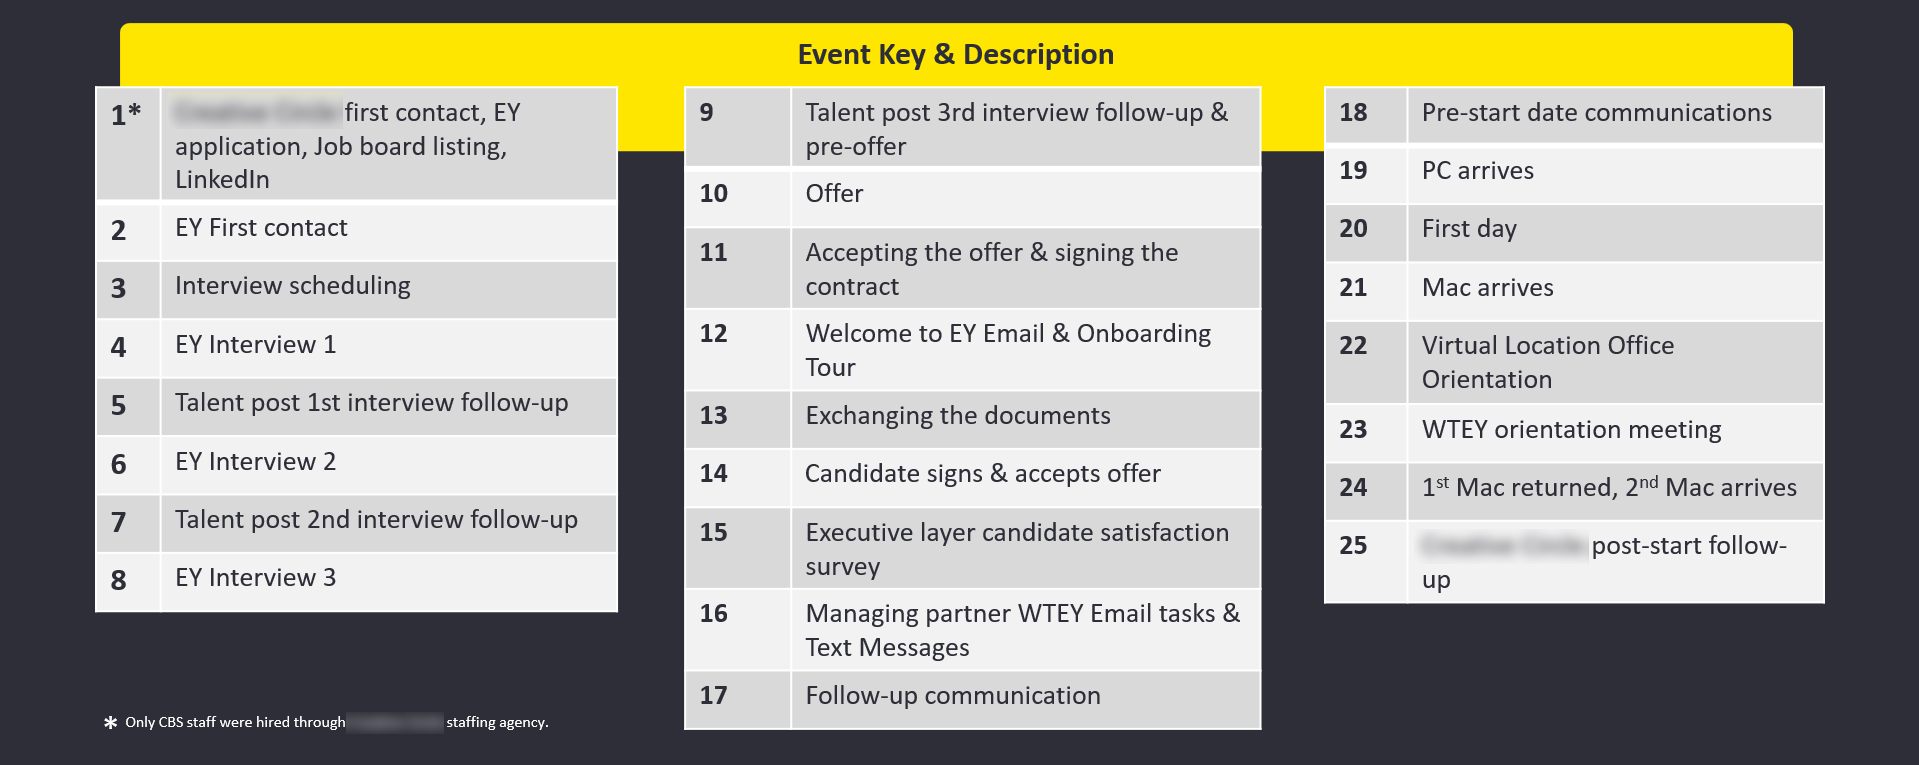
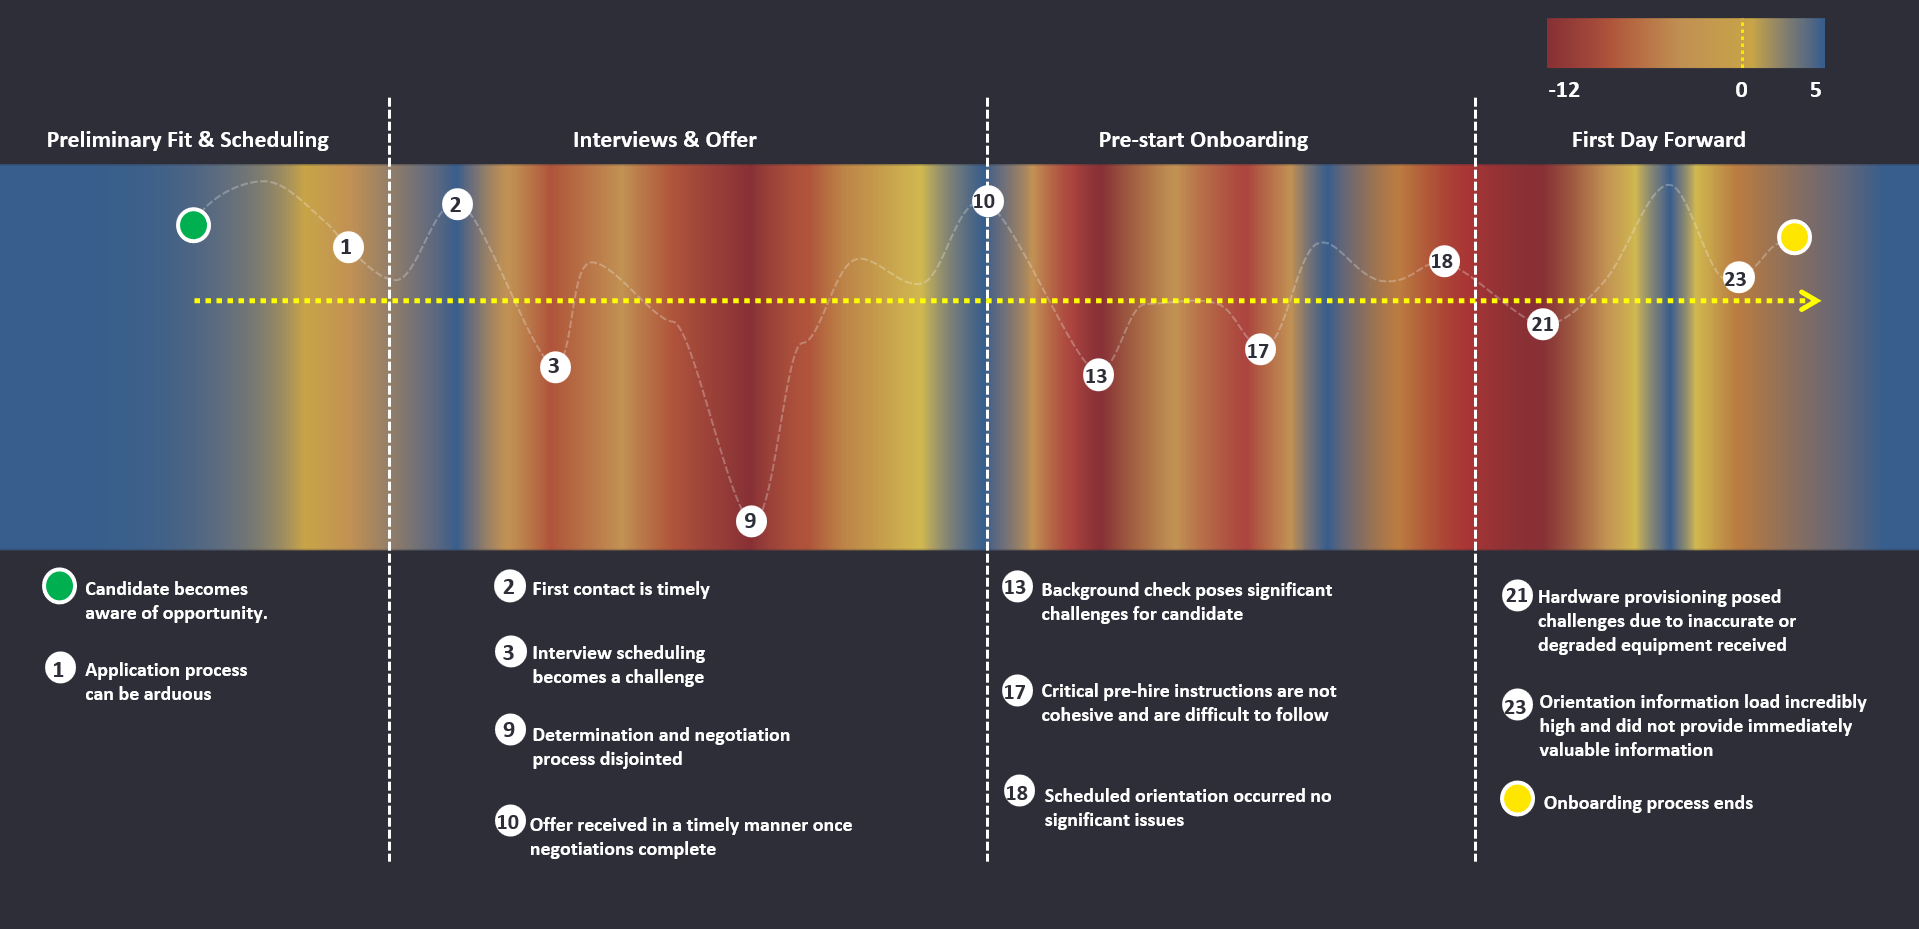
- End-to-end journey maps (pre-boarding → Day-90)
- Use-case taxonomy & prioritization framework
- Roles, RACI, and handoff model
Service & Interaction Design
- Service blueprints & content model
- Provisioning & access flows (self-serve + approvals)
- Notification templates & escalation paths
Systems & Enablement
- Figma prototype + component library (tokens, variants)
- Version-controlled requirements (F/NFR, accessibility)
- Measurement plan & implementation roadmap
- UAT scenarios and success criteria
Evidence & Visuals
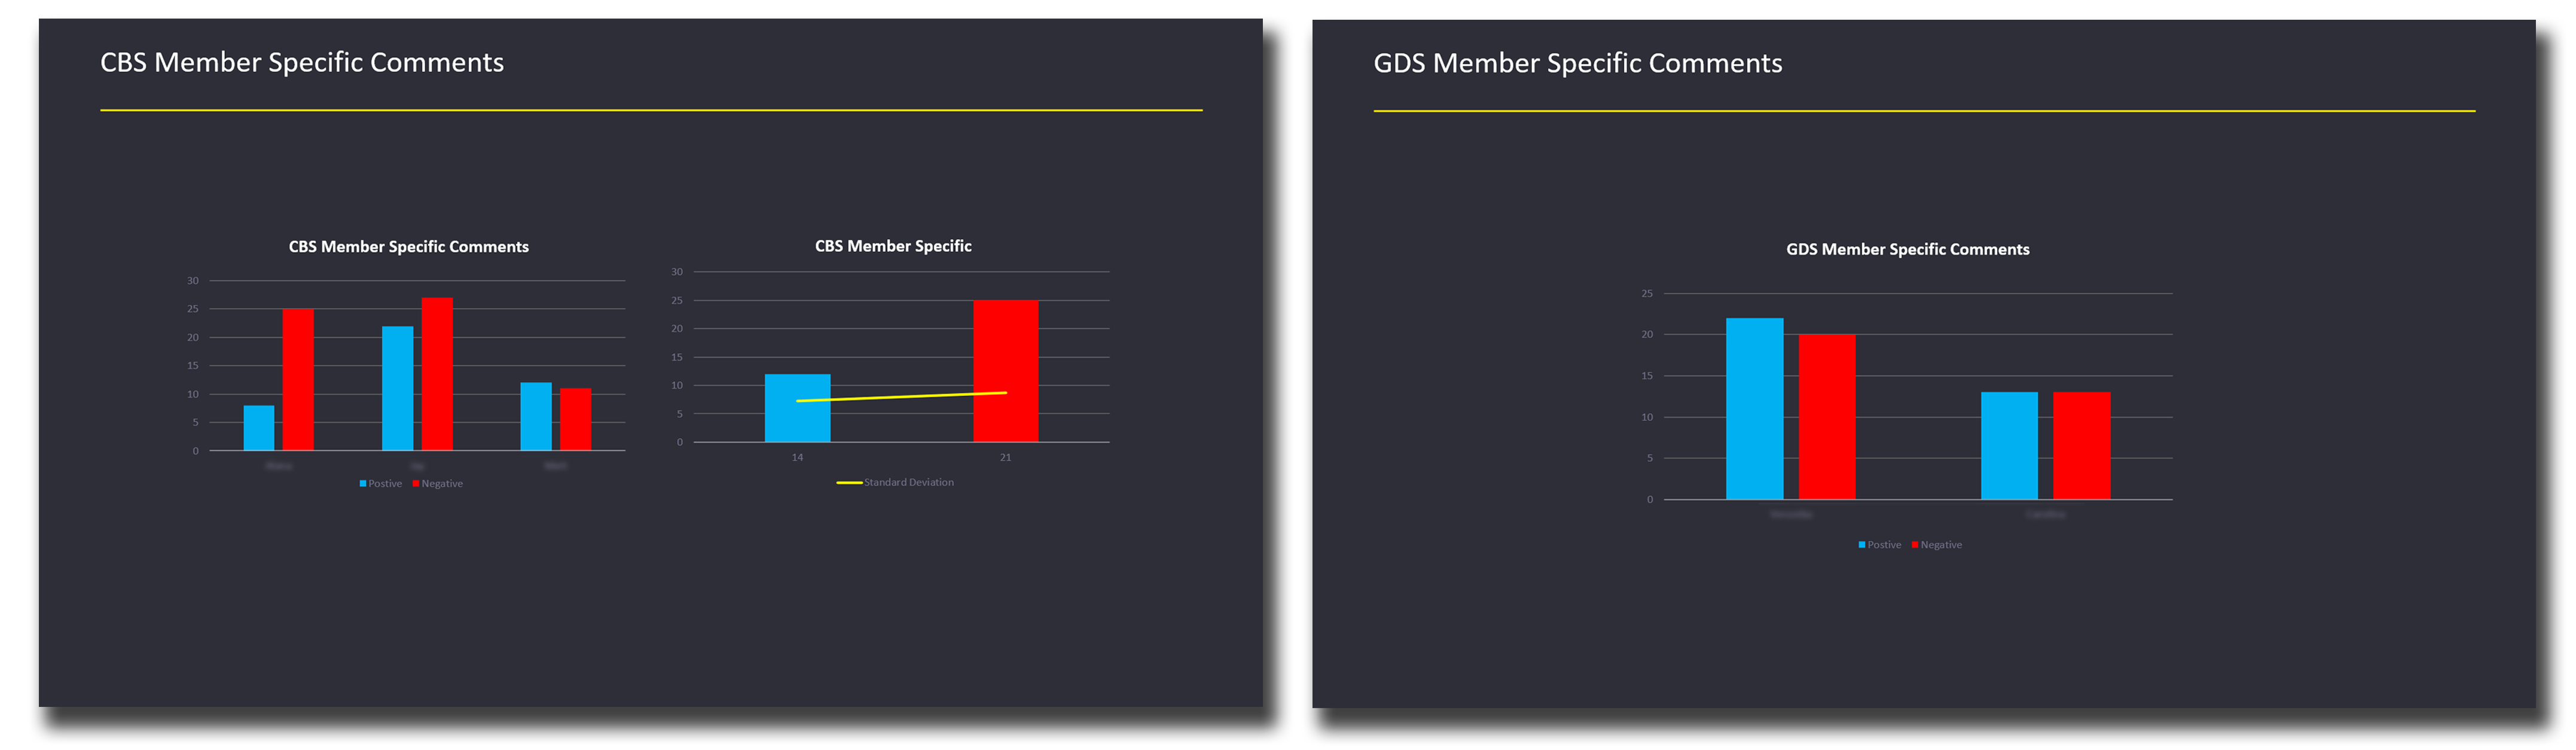
Stakeholder Feedback
“This is eye-opening, and will drive changes in our Employee Experience initiatives.”
Let’s Connect
If you’re tackling onboarding friction across HR/IT/business, I’m happy to compare notes and outline a measurable plan.
 LinkedIn
j.riggin@xd-pro.com
+1 978.844.8131